
AT&T Park has seen its wind decrease since 2007. It’s no Candlestick Park. (via Eric Molina)
I found that while the average wind speed at the “Friendly Confines” is about in the middle of the pack for MLB ballpark, the average wind velocity was near zero. This means that over the course of a season the wind is blowing out about as often as it is blowing in, and it is heading left-to-right about as often as it is going right-to-left.
It wasn’t long before I realized that I should do this for the other parks as well. As a quick reminder, a steady tail or head wind can change the distance of a long fly ball by three to four feet for every mile-per-hour of wind speed. You might also know, if you read The Hardball Times 2015 Annual, a 10 mile-per-hour wind can change the location of pitches by several inches as well.
I collected the wind data from the box scores from Baseball-Reference.com for all of 2015. I kept track of not just the wind speed, but also the direction. I don’t know of a better source for wind data from ballparks, nor do I know anything about the context of the measurements.
So, here’s the spot in this article where I go ballistic about the lack of clarity regarding these wind measurements. We don’t know where they are taken (at the ballpark or at the nearest weather station). We don’t know the altitude at which they are measured. They are only measured once as if the wind doesn’t change over a three-hour game. Regardless, this is the best wind data we have, so I’ll share it anyway.
First, let’s look at the wind speeds without concern for direction. Mike Fast’s blog Fastballs had been my previous source for average weather data by ballpark. His data was compiled for 2007. Here is a plot of his results against my 2015 values.

There is generally good agreement except in a few cases worthy of comment. The first thing to keep in mind is that there have been five new parks built since 2007. Open air Target Field replaced the indoor Metrodome in 2010. Nationals Park opened in 2008 replacing RFK Stadium. The other three new parks — Yankee Stadium, Citi Field, and Marlins Park — all seem to have similar average wind speeds as their predecessors.
I don’t know what the deal is with Tropicana Field. It is the only current all-indoor park. Yet, Fast claims there were three dates in 2007 played outdoors with an average wind speed of 6 mph. The San Francisco Bay Area ballparks seem to have less wind than in 2007. Possible reasons from most likely to improbable are natural season-to-season variation, an effect due to the prolonged drought in California, or baseball’s first climate change related effect.
By way of a summary, here’s a list sorted by the average wind speed for each park from 2015. The maximum and minimum wind speeds as well as the number of times the park hosted an outdoor game are also included.
| Team | Park | Avg | Max | Min | No. |
| Marlins | Marlins Park | 12.4 | 16 | 9 | 5 |
| Giants | AT&T Park | 11.8 | 22 | 3 | 81 |
| Mets | Citi Field | 11.5 | 28 | 1 | 81 |
| Athletics | O.co Coliseum | 11.1 | 24 | 3 | 81 |
| White Sox | US Cellular Field | 11.1 | 24 | 3 | 81 |
| Red Sox | Fenway Park | 10.9 | 23 | 3 | 81 |
| Twins | Target Field | 10.5 | 23 | 1 | 81 |
| Indians | Progressive Field | 10.3 | 24 | 2 | 80 |
| Cubs | Wrigley Field | 10.2 | 24 | 0 | 81 |
| Brewers | Miller Park | 10.1 | 23 | 0 | 36 |
| Tigers | Comerica Park | 9.7 | 24 | 2 | 81 |
| Jays | Rogers Centre | 9.6 | 18 | 2 | 52 |
| Phillies | Citizen’s Bank Park | 9.6 | 18 | 1 | 81 |
| Yankees | Yankee Stadium | 9.4 | 21 | 2 | 81 |
| Rangers | Globe Life Park | 9.3 | 17 | 3 | 81 |
| Padres | Petco Park | 8.5 | 17 | 1 | 81 |
| Royals | Kauffman Stadium | 8.5 | 19 | 1 | 81 |
| Dbacks | Chase Field | 8.1 | 15 | 4 | 35 |
| Pirates | PNC Park | 8.0 | 21 | 1 | 81 |
| Braves | Turner Field | 7.9 | 17 | 1 | 81 |
| Astros | Minute Maid Park | 7.8 | 14 | 1 | 13 |
| Reds | Great American | 7.6 | 17 | 1 | 81 |
| Cardinals | Busch Stadium | 7.1 | 17 | 1 | 81 |
| Rockies | Coors Field | 6.5 | 15 | 2 | 81 |
| Angels | Angel Stadium | 6.3 | 12 | 2 | 81 |
| Dodgers | Dodger Stadium | 6.0 | 10 | 0 | 81 |
| Nationals | Nationals Park | 5.8 | 14 | 0 | 81 |
| Orioles | Oriole’s Park | 4.2 | 14 | 0 | 78 |
| Mariners | Safeco Field | 2.5 | 6 | 0 | 76 |
| Rays | Tropicana Field | 0.0 | 0 | 0 | 0 |
One might be tempted to claim that Miami is the windiest park. However, they only held five games with the roof open, so the small sample size really negates that assertion. In my view, the Giants still are the reigning wind champions.
As mentioned earlier, I also found the average wind velocity. To understand the difference between average speed and average velocity, let’s simplify things by thinking about four wind measurements instead of 81. Below is a sketch of four winds, each represented by an arrow. The length of the arrow indicates the speed of the wind, while the direction of the wind is in the direction of the arrow. The speed of the wind in mph is listed next to each arrow.
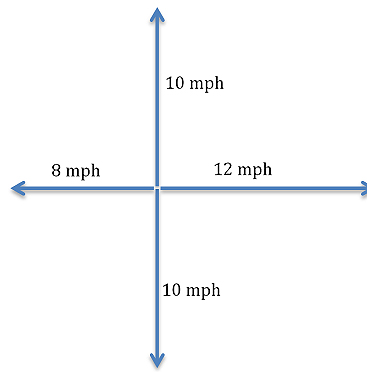
To find the average wind speed you just add all four speeds and divide by four. You should get 10 mph. To find the average velocity, you need to realize that the 10 mph wind up the page cancels out the 10 mph wind down the page. Meanwhile, the 12 mph wind to the right is reduced by the 8 mph wind to the left leaving a four mph wind to the right. Now divide by four.
The average wind velocity is one mph to the right, while that average wind speed is 10 mph. The average wind speed and the average wind velocity tell you different things. The average wind speed ignores direction. In baseball, direction makes all the difference. A 10-mph wind out will benefit the hitters, while a 10-mph wind in will help the pitchers.
The example we just did has a large average wind speed compared to the average wind velocity. This is typical of a situation where the wind direction varies a lot. We’ll see this often when we look at the results park-by-park. Let’s do that now.
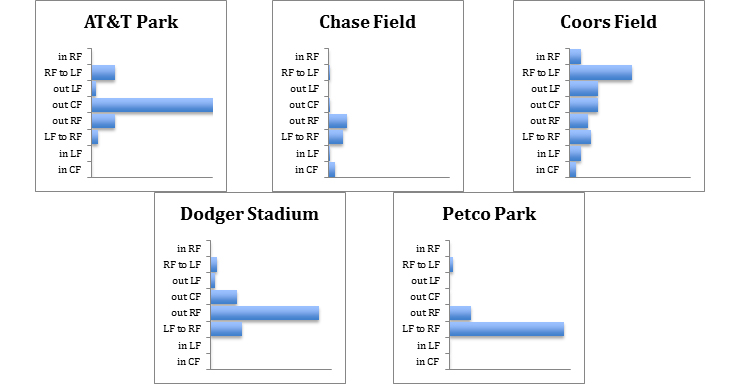
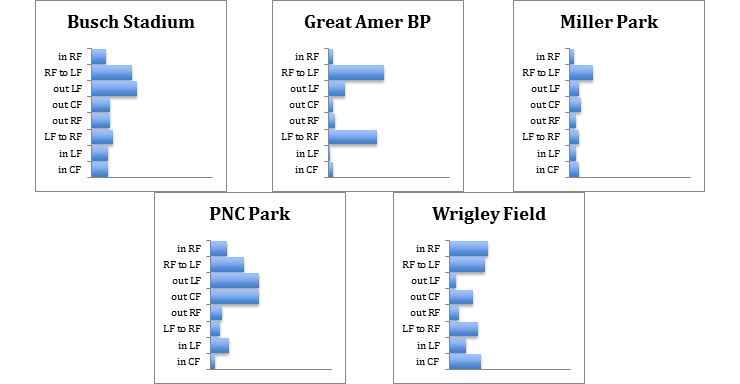
Below is a table of data for the National League ballparks, broken down by division. Each park has table with number of games played outdoors, the average wind speed, the average wind velocity and direction. That is followed by a chart of distributions of wind directions.
| Average | ||||
| Ballpark | # Games | Speed (mph) | Velocity (mph) | Direction |
| AT&T Park | 81 | 11.8 | 9.6 | out CF |
| Chase Field | 35 | 8.1 | 2.5 | LF to RF |
| Coors Field | 81 | 6.5 | 2.2 | out LF |
| Dodger Stadium | 81 | 6.0 | 4.7 | out RF |
| Petco Park | 81 | 8.5 | 6.9 | LF to RF |
| Average | ||||
| Ballpark | # Games | Speed (mph) | Velocity (mph) | Direction |
| Busch Stadium | 81 | 7.1 | 1.5 | out LF |
| Great American Ballpark | 81 | 7.6 | 1.5 | out LF |
| Miller Park | 36 | 10.1 | 3.2 | RF to LF |
| PNC Park | 81 | 8.0 | 3.5 | out LF |
| Wrigley Field | 81 | 10.2 | 0.9 | in CF |
| Average | ||||
| Ballpark | # Games | Speed (mph) | Velocity (mph) | Direction |
| Citi Field | 81 | 11.5 | 4.2 | out LF |
| Citizen’s Bank Park | 81 | 9.6 | 2.6 | out RF |
| Marlins Park | 5 | 12.4 | 7.2 | in CF |
| Nationals Park | 81 | 5.8 | 0.3 | out RF |
| Turner Field | 81 | 7.9 | 0.9 | LF to RF |

Some parks such as AT&T, Petco, Dodger Stadium, and Citi Field have fairly consistent wind directions resulting in relatively large average wind velocities. Others, such as Coors, Wrigley, and Nationals Park have widely varying wind directions and rather low average velocities. Great American and Turner Field are distinct in that the wind predominantly blows two ways along the same line – about half the time in each direction.
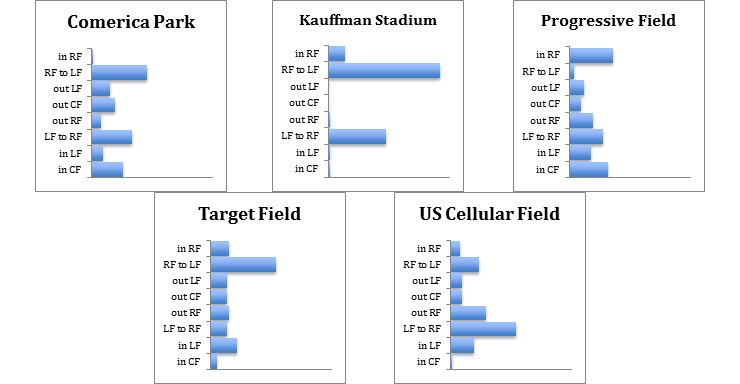
Now for the American League parks, again broken down by division, just because it’s easier to present the info in this way.
| Average | ||||
| Ballpark | # Games | Speed | Velocity | Direction |
| Angel Stadium | 81 | 6.3 | 4.6 | out RF |
| Globe Life Park | 81 | 9.3 | 1.9 | in RF |
| Minute Maid Park | 13 | 7.8 | 5.4 | out LF |
| O.co Coliseum | 81 | 11.1 | 10.6 | out RF |
| Safeco Field | 81 | 2.5 | 1.3 | out RF |

| Average | ||||
| Ballpark | # Games | Speed | Velocity | Direction |
| Comerica Park | 81 | 9.7 | 1.4 | RF to LF |
| Kauffman Stadium | 81 | 8.5 | 3.2 | RF to LF |
| Progressive Field | 80 | 10.3 | 2.2 | in CF |
| Target Field | 81 | 10.5 | 2.9 | RF to LF |
| US Cellular Field | 81 | 11.1 | 3.0 | out RF |
| Average | ||||
| Ballpark | # Games | Speed | Velocity | Direction |
| Fenway Park | 81 | 10.9 | 1.2 | out LF |
| Oriole Park | 78 | 4.2 | 1.1 | out CF |
| Rogers Centre | 52 | 9.6 | 1.9 | out LF |
| Tropicana Field | 0 | - | - | – |
| Yankee Stadium | 81 | 9.4 | 2.1 | RF to LF |

The O.co Coliseum has the most consistent wind of any ball yard. It blows out to right field nearly all the time. The average speed is almost the same as the average velocity. Kauffman Stadium is another park where the wind blows back and forth along the same direction like Turner Field. Most of the rest have rather erratic wind directions.
All of this wind data seems to me to provide a challenge for the sabermetricians. After all, this directional information about the wind should correlate with the distance of fly balls hit different directions in different parks. Is it possible to tease out the effect of the wind by park from Statcast trajectory data? How would I know? I can’t stand fighting with databases. Collecting this wind data was about as much of that as I could tolerate!